Visual Note Series
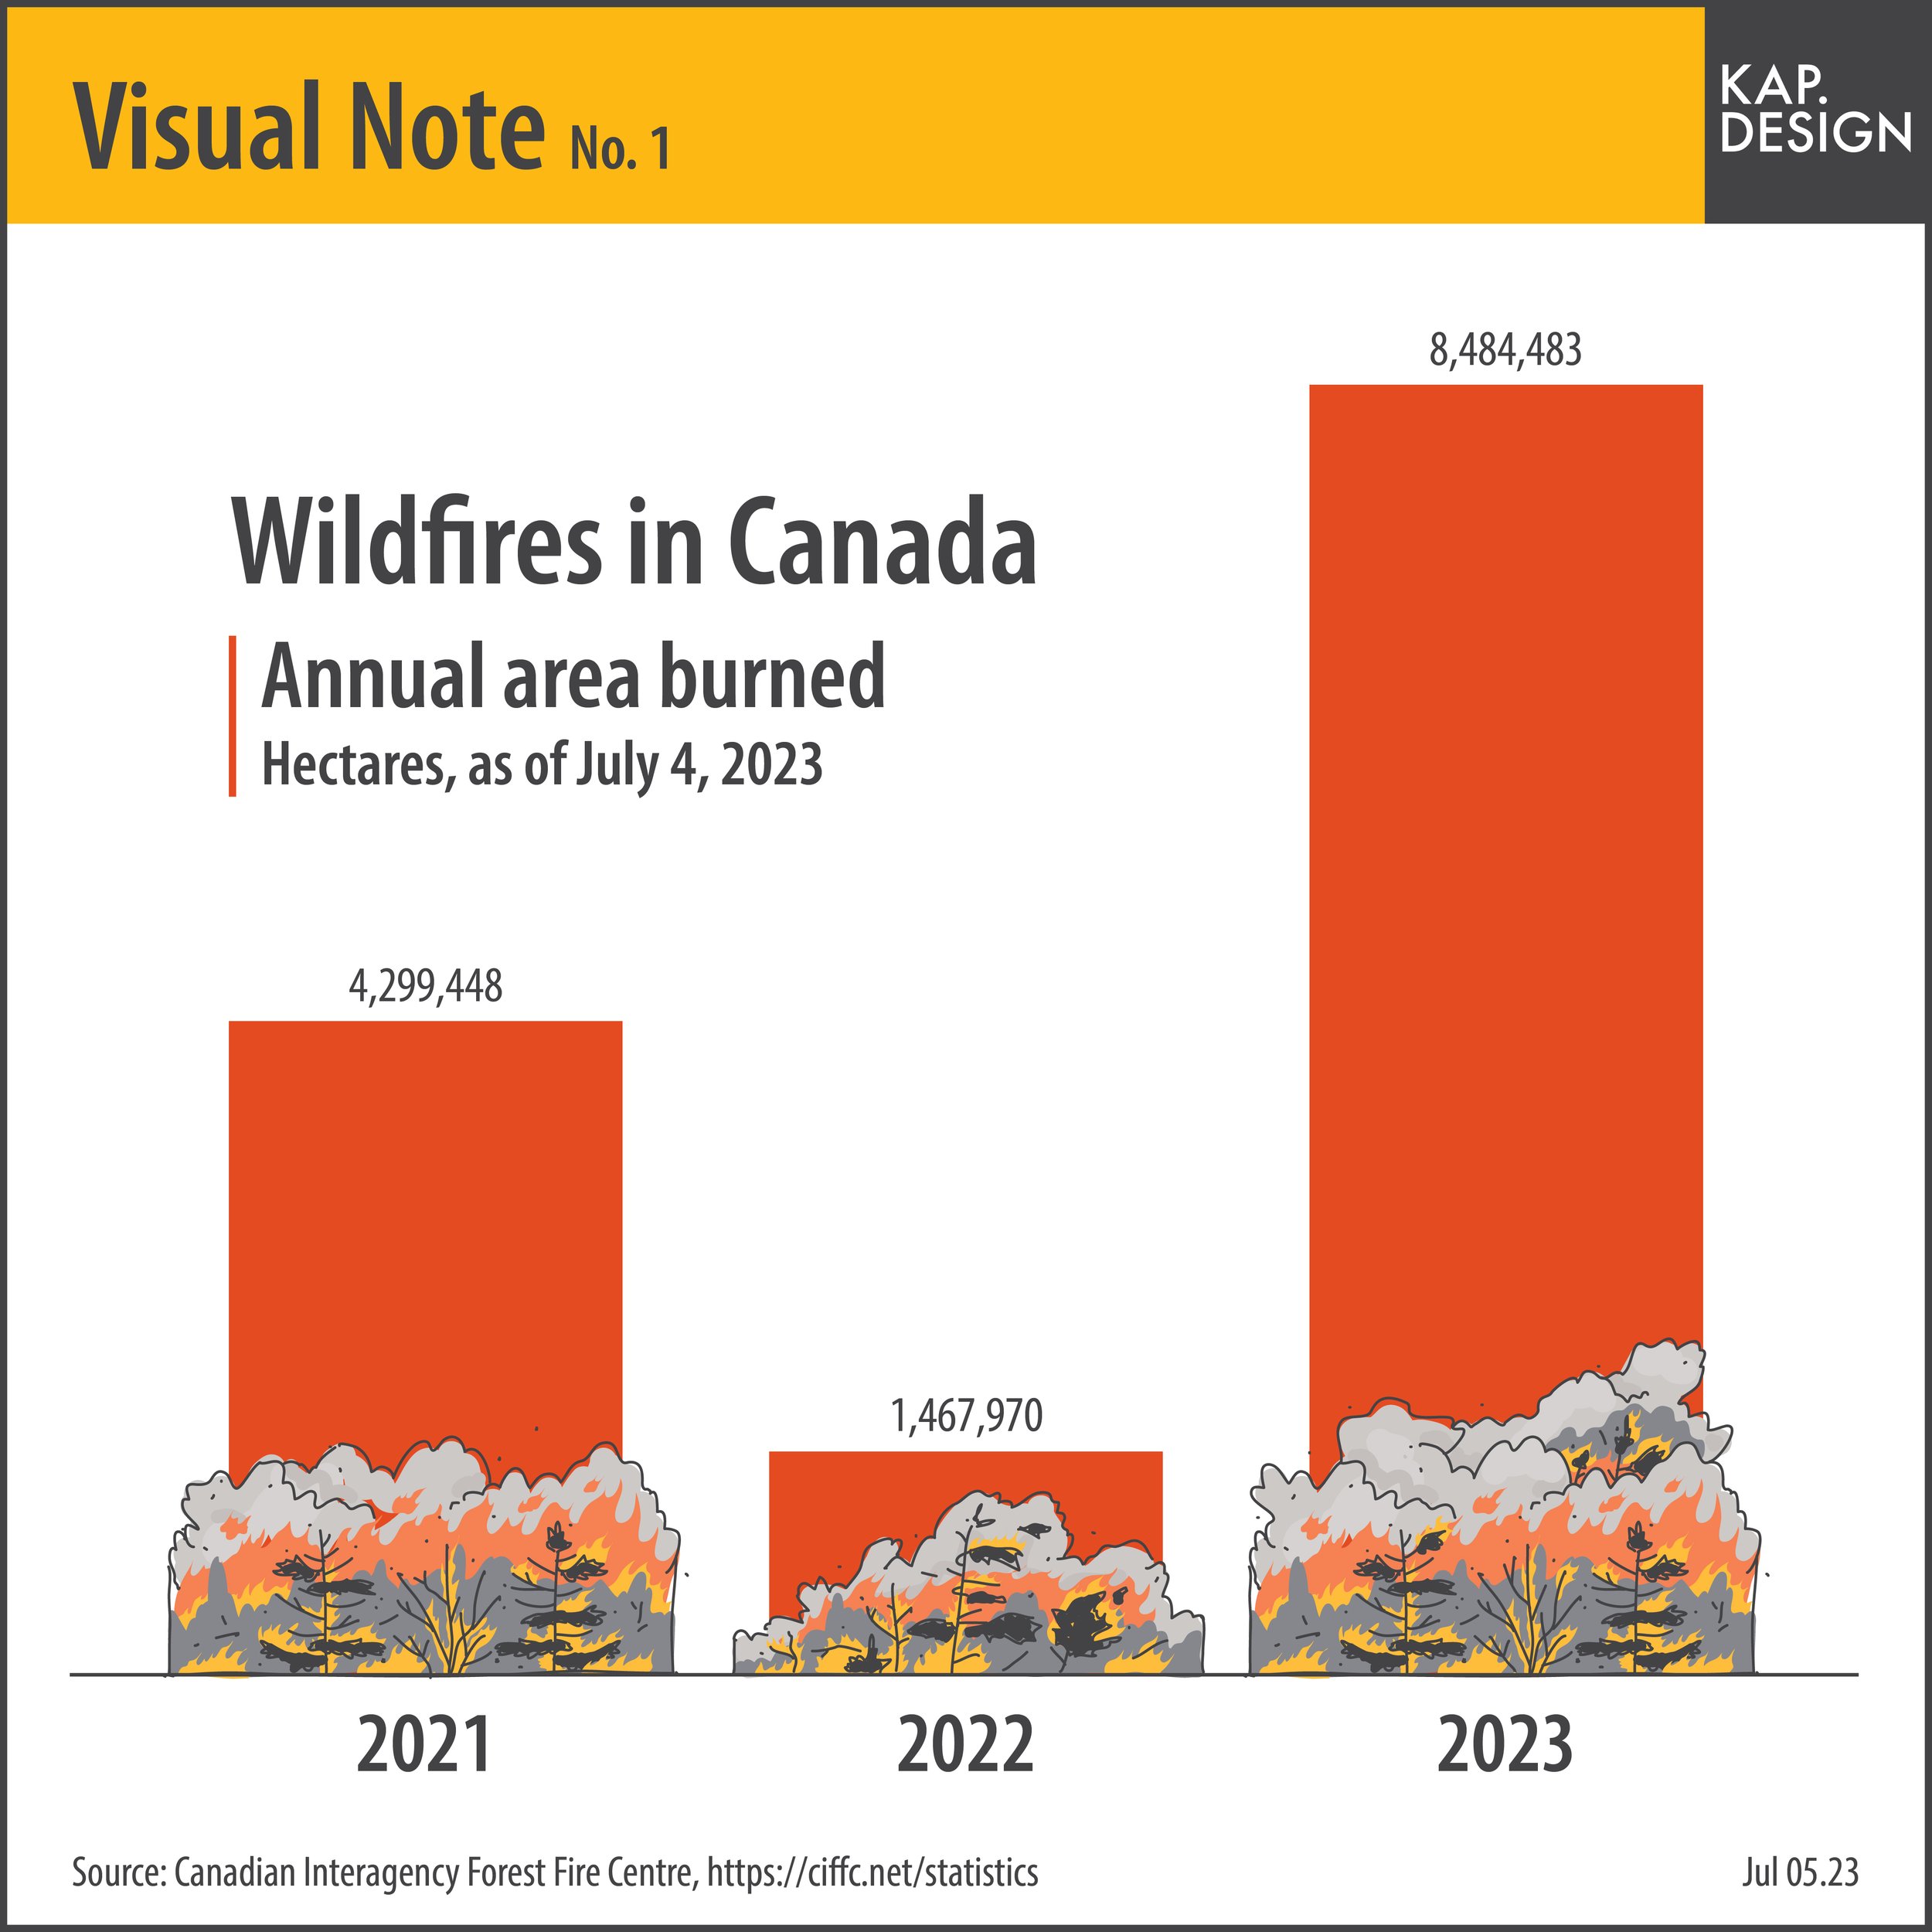
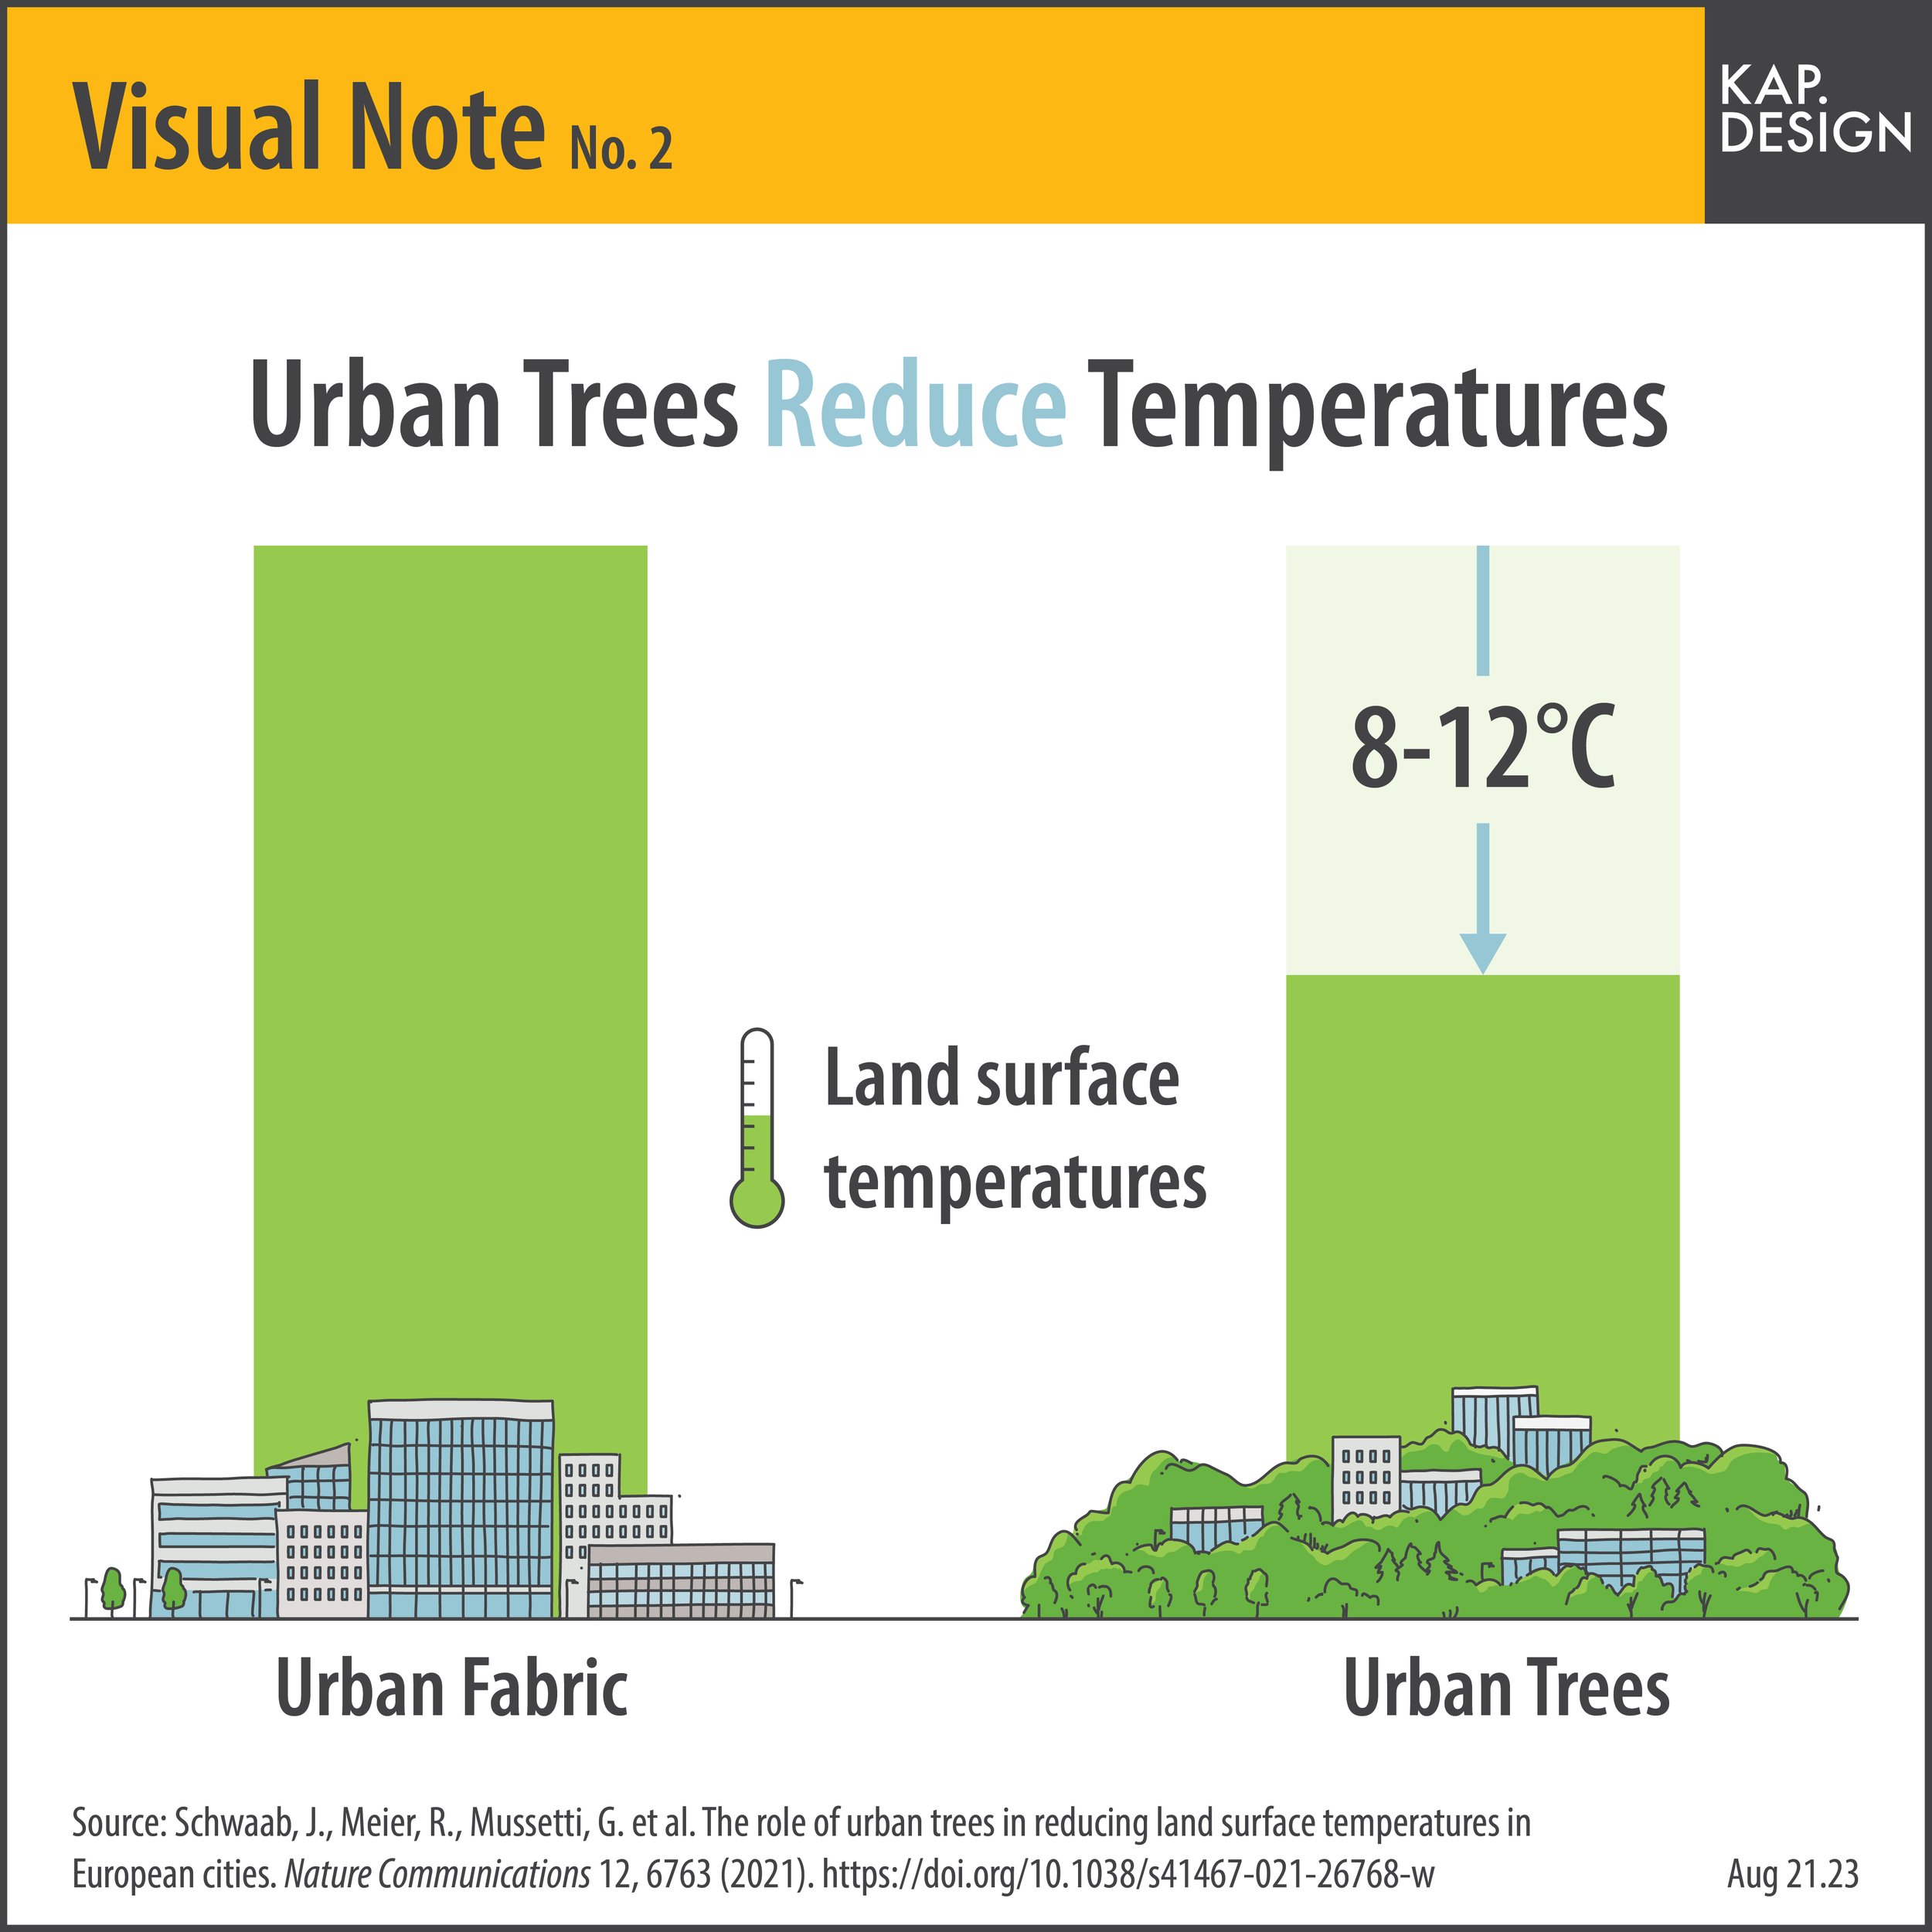
A series of infographics created by KAP to visualize interesting information discovered during the day-to-day rigmarole.


A series of infographics created by KAP to visualize interesting information discovered during the day-to-day rigmarole.


